
Graphs and Measurement PreK-2 Activity Bundle


Graphs and Measurement Grows Scientists Who Observe, Record, and Solve
⚠️ Clearance Item - Final Sale
All clearance sales are final. No returns, refunds, or exchanges.
SKU: SKU:92584
In stock
Couldn't load pickup availability


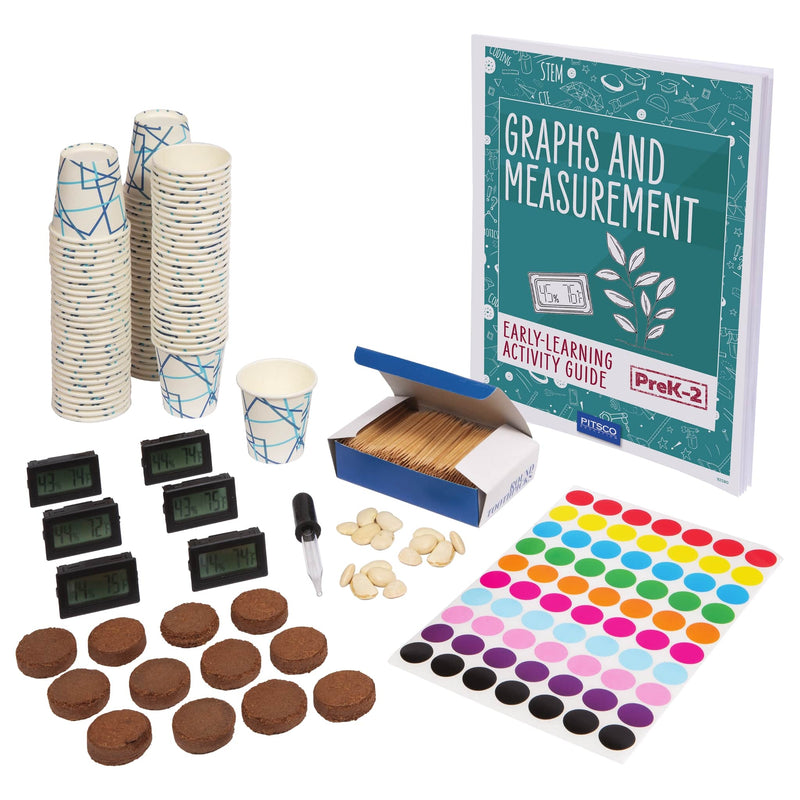
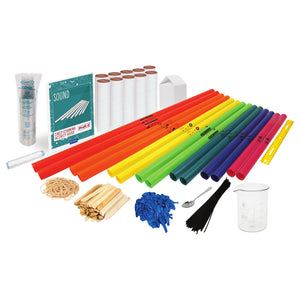
WHAT'S INCLUDED
- Activity guide
- Cup
- 12 coco coir pods
- Lima beans
- 6 mini thermometers
- Dot stickers
SPECIFICATIONS & SAFETY
- Students Served: 10-12
- Tools and Materials Required: Chart paper or digital graph for tracking class results; coloring materials; local nature spot flyers or maps; and recyclable materials


Frequently Bought Together
Real Data, Real Plants, Real Problem Solving
Landform Exploration
Students gather information about local landforms and bodies of water, then create advertisements encouraging people to visit a local natural site.
Plant Growth Investigation
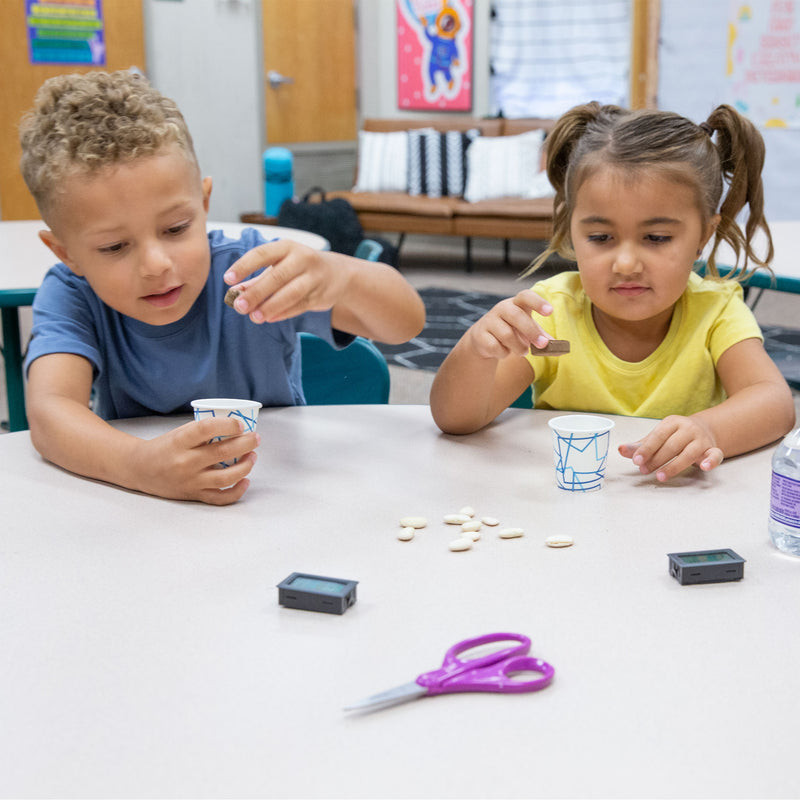
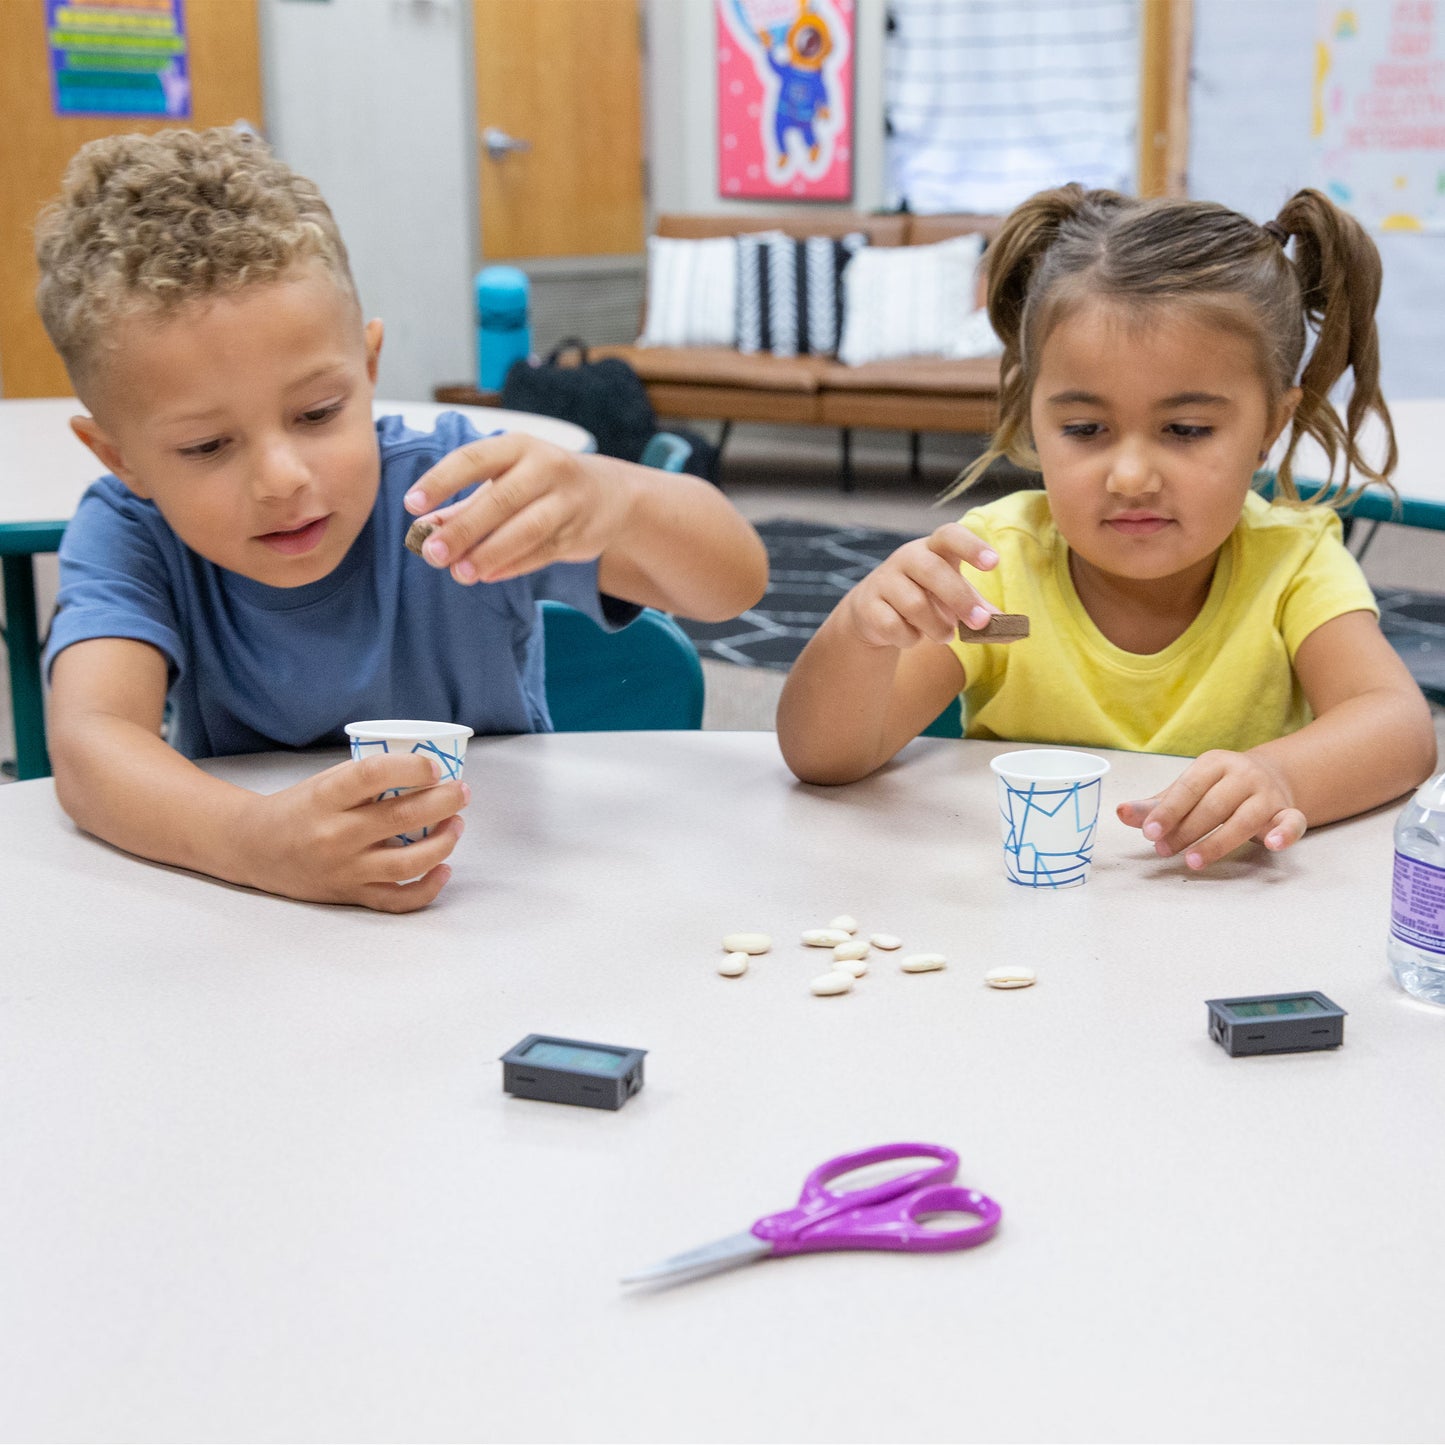
Using coco coir pods, lima beans, and mini thermometers, students design experiments to identify the best locations for growing plants and track results over time.
Data Collection and Graphing
Dot stickers turn abstract data into visual, tactile graphs that young learners can build and interpret with confidence.
Sun-Shade Engineering Challenge
The culminating challenge asks students to design a structure that reduces the effects of solar heat — connecting measurement data to a practical engineering solution.
What Students Will Do
- Identify and describe local landforms and bodies of water
- Create a persuasive advertisement for a local natural site
- Plant lima beans in coco coir pods and design a growth experiment
- Measure temperature and growth using mini thermometers and rulers
- Record and graph data using dot stickers on chart paper
- Design and test a structure that reduces heat from the sun
Compare Similar Products
| Feature |
Current Product
Graphs and Measurement PreK-2 Activity Bundle
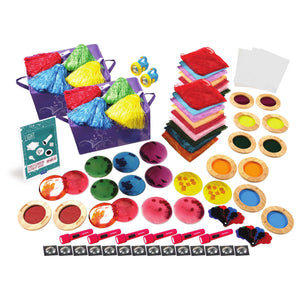
| Light PreK-2 Activity Bundle | Sound PreK-2 Activity Bundle |
|---|---|---|---|
| Price | $50.75 | $749.00 | $219.00 |
| Science Domain | Earth Science + Math | Physical Science — Light | Physical Science — Sound |
| Activities | 4 activities + 1 engineering challenge | 2 activities + 1 engineering challenge | 2 activities + 1 engineering challenge |
| Students Served | 10–12 | 10–12 | 10–12 |
| Engineering Design | |||
| Literacy Integration | — | — | |
| Materials Provided | Cup, coco coir pods, lima beans, thermometers, dot stickers | 2 Light and Color Grab and Go Sets, 6 flashlights | 2 Boomwhackers Sets, beakers, rubber bands, cups, and more |
| Additional Tools Required | Chart paper, coloring materials, local maps, recyclable materials | White paper, waxed paper, plastic bags, cups, tissue | Scissors, glue |
| Grade Level | PreK–2 | PreK–2 | PreK–2 |
| View Details | View Details |
Why Teachers Love Graphs and Measurement PreK-2 Activity Bundle
Science and Math in One Bundle
Measurement, graphing, and data analysis happen naturally alongside earth science and engineering investigations.

Real Experiments, Real Data
Students plant actual seeds, measure actual temperatures, and build actual graphs — no simulations or worksheets.

Connects to Local Geography
Landform activities tie directly to students' own neighborhoods, making science personal and relevant.

Tactile Graphing for Young Learners
Dot stickers make data visible and touchable, so even pre-readers can build and interpret graphs.

Engineering With a Purpose
The sun-shade challenge gives students a real reason to apply their measurement data to a design solution.

Affordable Entry Point
A complete five-lesson STEM bundle that fits the tightest classroom budgets while covering multiple standards.